About the Dashboard
- Metrics
- How to Use
- Comparison Table
- Glossary
- More Info
- API/Embed
Local government taxing units in Indiana submit their property tax and financial data to the State of Indiana each year through the Department of Local Government and the State Board of Accounts. These data are entered through web applications and wind up in databases specific to each application.
This dashboard was built to provide a straightforward view of key metrics that have been collected and are of interest to all of us – tax rates, income, spending, employment and school corporation metrics.
The taxing units in Indiana include all counties, cities, towns, townships, school corporations, public libraries, water & sewer districts and special districts. We call them taxing units because they collect part of their funding through property tax collection. It is important to remember that a property exists within the boundaries of many taxing units – and that each property is part of a specific and unique taxing district.
To find out which units comprise your taxing district (it’s simple –just type in an address!), go to the Report Builder and click on the "Search by Address" tab.
The Metrics
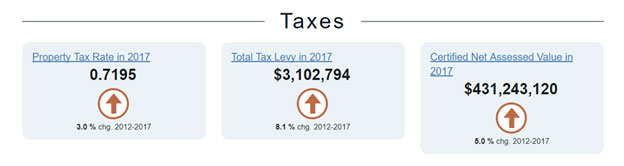
These metrics focus on three fundamentals for each taxing unit (local government unit) in Indiana – the property tax rate, the total tax levy and certified net assessed value.
Property Tax Rate: the percentage used to determine how much a property taxpayer will pay per $100 of certified net assessed value.
Property Tax Levy: the amount, in specific dollars, that a taxing unit may raise each year in property taxes.
Certified Net Assessed Value: the assessed value of property minus any deductions or exemptions, as certified to the Department of Local Government Finance by each County Auditor.
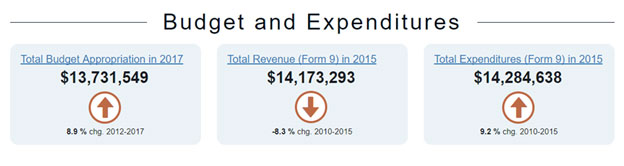
These key metrics provide insight into the total amount of funding the unit plans for coming year (as reported to the Department of Local Government Finance) and the amount of revenue and expenditures (or disbursements) actually received and spent by the unit for the calendar year just ended (as reported to the State Board of Accounts).
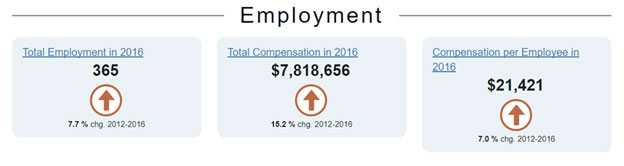
Public employment totals are calendar-year based and are the count of all employees during the calendar year, regardless of full- or part-time status and length of employment. This is important to note, since there may be employees counted who were on the payroll for only a few weeks or days and for a variety of reasons (retirement, just hired at the end of the year, etc.).
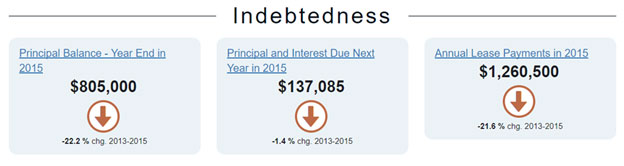
Taxing units can take on debt in the form of bonds and leases. These metrics show the total principal and interest paid during the latest calendar year, as well as the total as the total amount paid for leases (of equipment, buildings, etc.).
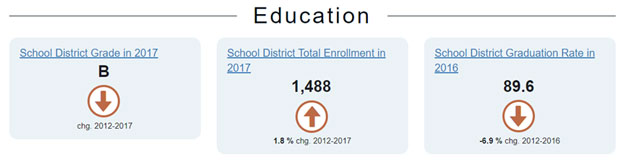
Along with financial information provided for the school corporations, there are also three metrics provided (school corps only) that show the A to F grade for the latest year, as well as the total enrollment and the graduation rate.
How to Use the Interactive Dashboard
The dashboard is comprised of 3 primary components – the dashboard itself with displays the key metrics, along with a comparison table (where you can either compare multiple units side-by-side or view a time series of the data values for a single unit), and an interactive comparison chart to view these metrics for one or more units and over time.

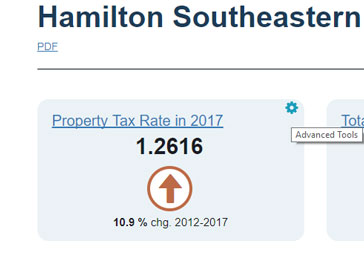
The dashboard has multiple metrics displayed in “badges”, each one providing the name, the value, an arrow indicating the 4-year trend (in % change unless otherwise noted). The badge itself is interactive and when the user hovers over the badge, a tool symbol will appear just click on that and you can accomplish so many things.
To start, just begin typing in the name of a school corporation or city or town, county or township in the blank box. An “auto-list” will appear and you choose the one that matches what you want.

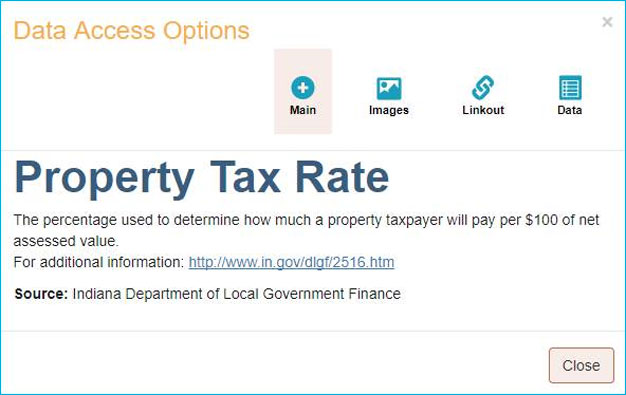
When you click on it, you will see a variety of data access options – just click on each one to see what you can do!
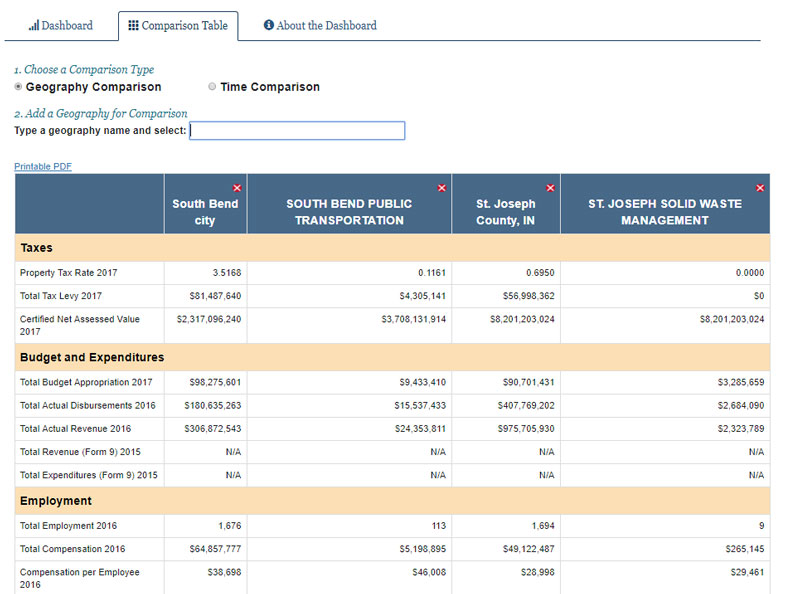
Comparison Table
The comparison table offers two distinct views – a comparison of many units, side by side OR a comparison for one unit, but over time.
Glossary
| Dashboard Item |
Description |
| Tax rate |
The percentage used to determine how much a property taxpayer will pay per $100 of net assessed value. |
| Tax levy |
The specific amount of money that a taxing unit may raise each year in property taxes. |
| CNAV |
The assessed value of property minus any deductions, exemptions and/or credits as certified to the Department of Local Government finance by the County Auditor. |
| Budget appropriation |
The creation of a budget for the upcoming fiscal year provides a financial plan for each local government and the total appropriation reflects the amount of money that will be required. |
| Actual disbursements |
The amount of money disbursed by the local government for the calendar year just ended – this is actual spending, not planned spending.
The following items are excluded from this disbursements figure:
- Payments to or on Behalf of Beneficiaries (D701)
- Payment of Taxes and Other Payroll Withholdings (D702)
- Distributions to Other Governmental Entities (D703)
- Transfer Out - Transferred to Another Fund (D704)
- Interfund Loan - Loaned to Another Fund (D705)
- Interfund Loan - Repaid to Another Fund (D706)
- Purchase of Investments (D900)
|
| Actual revenue |
The income received by the local unit during the calendar year just ended (sometimes called receipts). It comes from taxes, fees, grants and other sources. |
| Total employment |
Public employment counts for each unit of government throughout the state, regardless of full- or part-time status or duration of employment. It is literally the total number of employees during the most recent calendar year just ended. |
| Total Compensation |
Total amount of compensation received by all public employees during the given calendar year. |
| Compensation per employee |
A rough "per capita" amount of compensation, which doesn't account for full or part-time status or duration of employment. |
| Annual Debt Payments - Principal |
The amount of principal paid during the calendar year just ended. |
| Annual Debt Payments - Interest |
The amount of interest paid during the calendar year just ended. |
| School District A-F Grade |
Part of Indiana's Education Accountability System, which in part measures individual student academic performance and growth-to-proficiency. |
| School District Total Enrollment |
Public school district, or corporation, enrollment for the latest year. |
| School District Graduation Rate |
Public school district’s graduation rate as calculated by the Indiana Department of Education. |
More Information
Property taxation and local government finance can be complicated to explain – but there is much more information available for the avid reader! Here are links to additional material you may find useful:
API/Embed: Guidance for Local Officials
Embed the Dashboard into Your Own Government Website with the Advanced Tools Feature
We provide multiple ways for local governments in Indiana to link to or embed the dashboard within their own local website. From a basic link to your dashboard or to embedding straight within your site – the user stays on your site this way, but the data will be refreshed by Gateway!
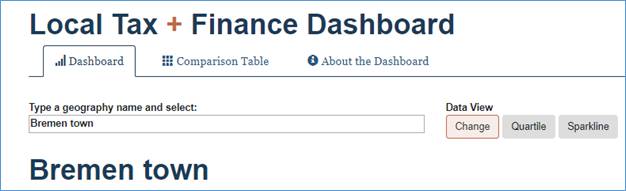
- Select your unit (city, town, school, county, etc.) by typing in its name in the search box – in the screenshot below we typed in Bremen and selected from the autofill list that comes up.
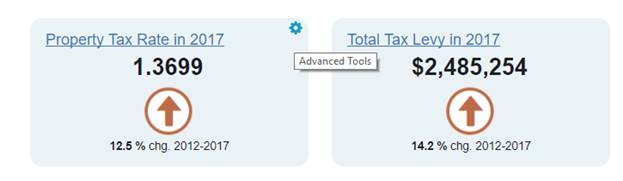
- Hover over one of the dashboard “badges” and click on the title in the badge or the gear icon – in the example below, we hovered over the Property Tax Rate and the “gear” image appeared so we could click on it to get the advanced tools.
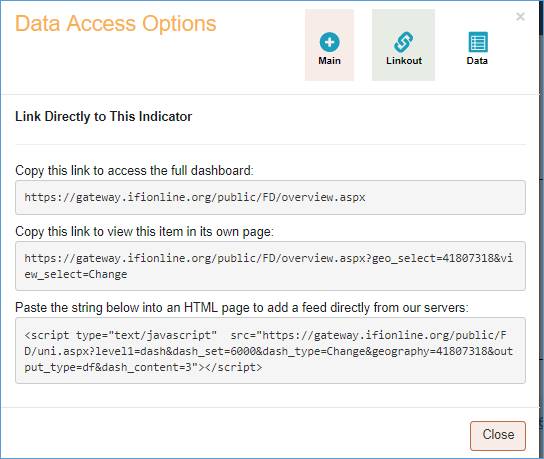
The screenshot below shows the Advanced tools/data options. By clicking on the Linkout you get multiple options from linking to embedding.
The link to the full dashboard allows folks to get directly to the Gateway dashboard.
The second option will link the user directly to your government unit’s dashboard on Gateway.
Finally, you (or your web master) can embed the JSON into your own webpage and make the dashboard your own – it will always be fed the latest dashboard updates from the Gateway server, but be part of your own website.